

Most absence cost numbers HR presents in leadership meetings fall apart under the first hard question. Someone asks "how did you get $340 per absence day?" and the answer is either a vague industry benchmark or a fully-loaded salary divided by working days. Neither survives scrutiny, and neither helps you decide anything.
The problem isn't that absence costs are hard to estimate. It's that a single average is useless for decisions. A missed day in your billing team and a missed day on your production floor are not the same event, and pretending they are is how staffing budgets get wasted. What you actually need is a model that separates the components, lets you stress the assumptions, and connects the output to a specific action — hire, backfill, outsource, or absorb.
This is a walkthrough of how to build that model in a spreadsheet, what to put in each cell, and how to wire the outputs to decision thresholds so the workbook does something useful instead of sitting in a shared drive.
Why the "salary ÷ working days" number is quietly wrong
The most common cost-per-absence figure floating around HR decks is annual fully-loaded salary divided by roughly 260 working days. Someone earning about $65k fully loaded comes out to around $250 a day, and that number gets stamped on every absence regardless of role.
The issue is that figure assumes the cost of an absence equals the wage you paid for a day of not-working. But if the person is salaried and still gets paid, you didn't save or lose that wage — the wage is sunk. The real cost is whatever the absence caused: missed output, coverage overtime, a delayed shipment, a customer who didn't get called back, or nothing at all if the work simply waited a day and no one noticed.
That's the pattern worth internalizing. Absence cost is a function of coverage requirement and output sensitivity, not wage. A salaried analyst who can catch up tomorrow costs close to zero. A single coverage-critical nurse or line lead who triggers overtime and a scramble can cost several times their daily wage.
Any model built on wage-per-day will overstate the cost of absorbable roles and badly understate the cost of coverage-critical ones — which means it points you in exactly the wrong direction on staffing decisions.
The four cost components your model needs to separate
Instead of one number, break each absence into components. This is what makes the workbook defensible and what makes sensitivity testing meaningful — you can stress one lever without touching the others.
Stop managing absences manually.
Absencely simplifies leave requests, approvals, and absence monitoring for your entire workforce.
- Automated leave tracking
- Manager approval workflows
- Compliance & reporting tools
No credit card required
| Component | What it captures | Typical driver | Applies to |
|---|---|---|---|
| Coverage cost | Overtime, temp fill, or backfill labor to cover the gap | Overtime multiplier, temp rate | Coverage-critical roles only |
| Lost output | Work that doesn't happen and can't be recovered | Revenue-per-hour, margin | Output-sensitive roles |
| Ripple cost | Delays, rework, coordination overhead hitting other people | Team dependency depth | Roles others wait on |
| Absorbed / zero | Work waits, no measurable cost | Slack in the workflow | Most back-office roles |
The insight most models miss: a single absence rarely triggers all four. A warehouse picker during peak season triggers coverage cost (overtime) and lost output (unshipped orders). The same picker in a slow week might trigger nothing. The model has to let cost swing with conditions, which is why static averages fail.
For the workbook, give each role a component profile — check which of the four apply and at what intensity. A finance analyst might be 90% absorbed, 10% ripple. A production lead might be 60% coverage, 30% output, 10% ripple.
Building the spreadsheet: the assumption block
Every reliable model puts assumptions in one clearly labeled block, separated from the calculations. When someone challenges a number, you point to a single cell they can change and the whole model updates. Bury assumptions inside formulas and the model becomes an argument nobody can win.
-
Fully-loaded daily rate by role or role group (wage + benefits + payroll tax ÷ working days). This is an input, not your answer.
-
Coverage requirement — a percentage (0–100%) of how often this role must be covered when absent. A cashier at a two-register store is near 100%. A three-person analytics team is maybe 20%.
-
Coverage method and cost — overtime multiplier (e.g., 1.5x) or temp/agency rate per day. Whichever you'd actually use.
-
Output value per day — revenue or margin the role produces when working. Leave blank for non-revenue roles.
-
Output recoverability — what fraction of missed output is permanently lost vs recovered later. A same-day service call lost forever is 100%. A report that ships a day late is near 0%.
-
Ripple factor — a multiplier for downstream disruption, usually between 0 and 0.5 of the daily rate for connected roles.
-
Absence frequency — expected absence days per role per year, pulled from your actual data, not a guess.
Here's the assumption block to build, roughly in this order:
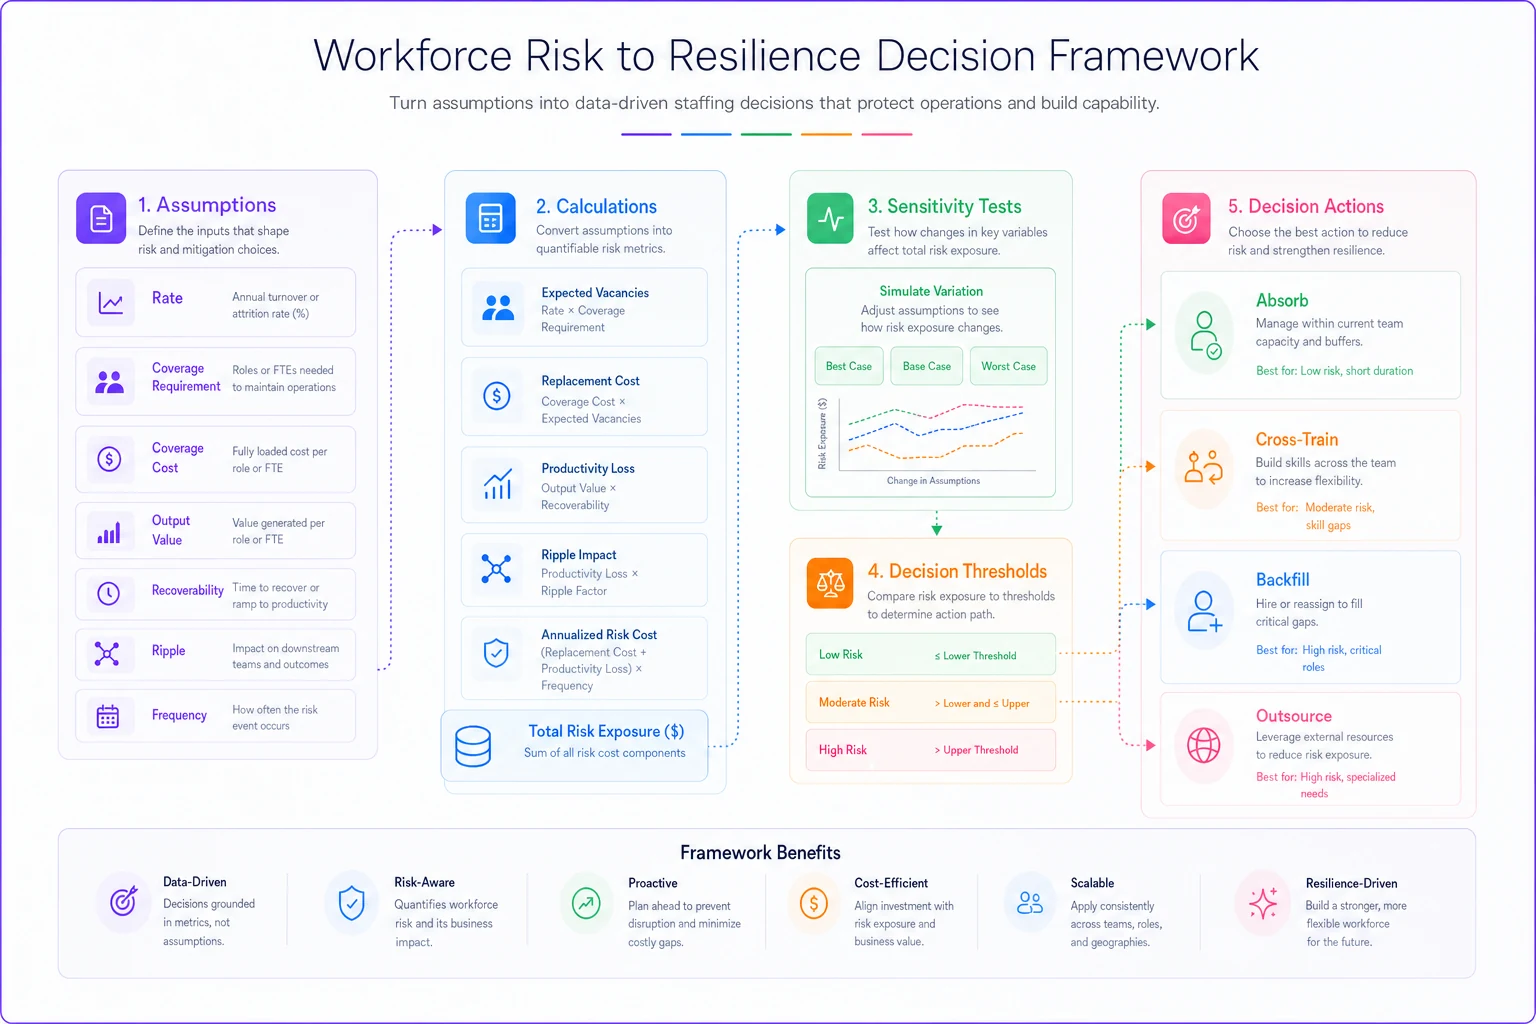
Use your actual coverage patterns to set the coverage requirement instead of guessing — it's the lever that usually changes the decision.
The single most valuable assumption in that list is coverage requirement, because it's the one that separates roles that matter from roles that don't — and it's the one people set by gut instead of data. If you've already done the work of turning your absence data into staffing forecasts, you likely have the raw coverage patterns to set this number properly instead of guessing.
The calculation logic, in plain terms
The cost-per-absence-day for a given role works like this, spelled out so you can build the formula:
Cost per absence day = (Coverage requirement × Coverage cost) + (Output value × Output recoverability × loss fraction) + Ripple cost
Walk through it with a real setup. Say you have a customer support lead, fully loaded at about $280/day:
-
Coverage requirement
70% (someone usually has to cover the queue)
-
Coverage method
overtime at 1.5x → coverage cost ≈ $420 for the covered day
-
Output value
hard to isolate, so set near zero and rely on coverage + ripple
-
Ripple
escalations back up, junior agents stall → set at 0.3 × $280 ≈ $84
Cost per absence day ≈ (0.70 × $420) + (0) + $84 ≈ $378.
Now run the same math on a data analyst at the same daily rate but 15% coverage requirement, no overtime cover (work just waits), full recoverability:
-
Coverage requirement
15%
-
No overtime coverage — work waits
-
Full recoverability of output
-
Small ripple
Cost per absence day ≈ (0.15 × $0 real coverage) + (near-zero lost output) + small ripple ≈ $40–$60.
Same salary. A roughly 7x difference in absence cost. That gap is the entire reason to build the model — and it's completely invisible if you use one blended average.
Sensitivity testing: stress the two or three levers that move the answer
A model you can't stress-test is just an opinion with decimals. Sensitivity testing tells you which assumptions actually change the decision and which ones don't matter.
Build a simple data table (Excel's Data Table feature, or a manual grid) that varies your two most uncertain inputs and shows the resulting cost. For most operations the two levers that swing the answer hardest are coverage requirement and coverage cost (overtime vs temp rate).
| Coverage requirement ↓ / Overtime multiplier → | 1.25x | 1.5x | 2.0x |
|---|---|---|---|
| 50% | $259 | $282 | $364 |
| 70% | $329 | $378 | $476 |
| 90% | $399 | $462 | $588 |
What this reveals is more useful than any single figure. The cost barely moves between $259 and $364 in the low-coverage row, but nearly doubles as coverage requirement climbs. That tells you: for this role, nailing down the true coverage requirement matters far more than negotiating overtime rates. You now know where to spend your investigation time.
The mistake here is testing ten variables at once. Pick the two or three that are both uncertain and influential. If an assumption is uncertain but doesn't move the output, stop worrying about it.
Scenario analysis: three states, not one
Sensitivity tests move one lever. Scenarios move a coherent set of levers together to describe a real situation. Build at least three:
-
Normal week — baseline coverage requirement, standard overtime, average frequency.
-
Peak / crunch — coverage requirement jumps, output becomes non-recoverable (missed orders are gone), frequency often rises with stress.
-
Thin-staffing — you're already short, so each absence forces overtime and ripple multiplies.
The revealing part is watching a role's cost move across scenarios. That support lead might cost around $378 on a normal day, but in a thin-staffing scenario where overtime hits 2x and ripple compounds, the same absence can push past $600. A role that looks affordable to absorb on average becomes expensive precisely when you can least afford it — which is the exact moment staffing decisions get made in a panic.
Scenario analysis is what prevents the classic error: budgeting for the average and getting blindsided by the peak.
Wiring outputs to decision thresholds
A cost number is not a decision. The workbook earns its keep when you attach thresholds that convert cost into action. Set these once, agree on them with leadership, and let the model flag the call.
-
Below ~$100/absence-day → Absorb. Not worth backfilling. Let the work wait. Manage frequency, not each event.
-
$100–$300 → Cross-train coverage. Cost justifies having a trained backup internally, but not a standing external arrangement.
-
$300–$600 → Standing backfill or overtime plan. Pre-arrange coverage; the cost of scrambling exceeds the cost of readiness.
-
Above ~$600, or non-recoverable output → Outsource / surge capacity / add headcount. The role is expensive enough when absent that an external safety net or extra body pays for itself.
These break points aren't universal — set them against your own overtime rates and margins — but the logic holds. The threshold you choose determines your action, and the model tells you which band each role lands in under each scenario.
This also gives you a clean rule for what to automate. Predictable, low-cost, absorbable absences are exactly the ones worth handling with standing rules rather than manual review — the same logic behind auto-approving recurring predictable leaves safely. High-cost, coverage-critical absences are the ones that deserve a human eye and a pre-built surge plan.
A real scenario: a 40-person regional distributor
A mid-sized distribution company — around 40 employees across warehouse, dispatch, and back office — was budgeting absence at a flat $220/day across everyone, straight from the salary-divided-by-days method. Their absence line ran roughly $90k–$100k a year in their planning model, and leadership treated it as a fixed cost of doing business.
When they rebuilt it with component-based costing, the picture split hard. Back-office absences (about 60% of their absence days) came in around $50–$70 each — almost entirely absorbable, wildly overbudgeted. Warehouse and dispatch absences during peak shipping windows came in closer to $480–$620 each once overtime and missed same-day shipments were counted.
The flat average had been quietly funding coverage for roles that didn't need it while leaving the genuinely expensive gaps unplanned. After reallocating — cross-training two dispatch roles, setting a standing overtime plan for peak weeks, and dropping the reflexive backfill on back-office days — their effective absence spend didn't balloon. It shifted. Total planned cost landed close to where it started, but the money was finally pointed at the absences that actually hurt. The number of "we're scrambling to cover the dock" mornings dropped noticeably over the following peak season.
The lesson wasn't that absences cost more or less than they thought. It was that the average had been hiding a 10x spread, and the spread was the whole story.
When this model is worth building — and when it isn't
Build it if you have coverage-critical roles, meaningful overtime or temp spend, or you're being asked to justify staffing and outsourcing decisions with numbers. The model pays off fastest anywhere absence triggers overtime or lost revenue.
Skip the full version if your team is small, uniformly absorbable, and absence rarely forces coverage. A one-page component estimate is fine; you don't need scenario grids for a five-person office where work just waits a day.
Who should not lean on this alone: anyone using it to make individual employment decisions. This is a planning and budgeting model for role groups and staffing strategy, not a scorecard for judging people. Coverage requirement and output value are properties of the role and the workflow, not the person who happened to be out.
Putting the workbook to work
The point of a cost per absence model isn't precision to the dollar — it's directional truth you can defend and act on. Once each role group has a component profile, a sensitivity grid, and a threshold band, absence stops being a mystery line item and becomes a set of decisions: absorb these, cross-train those, pre-arrange coverage here, outsource there.
Start with your five or six most coverage-critical roles. Build the assumption block, run one sensitivity table on coverage requirement and overtime, sketch three scenarios, and drop in the thresholds. You'll almost certainly find that a handful of roles account for the bulk of your real absence cost — and that a few roles you've been diligently backfilling never needed it at all. That reallocation, not a tidier average, is where the money actually is.
Start with your five or six most coverage-critical roles. Build the assumption block, run one sensitivity table on coverage requirement and overtime, sketch three scenarios, and drop in the thresholds. You'll almost certainly find that a handful of roles account for the bulk of your real absence cost — and that a few roles you've been diligently backfilling never needed it at all. That reallocation, not a tidier average, is where the money actually is.
Ready to optimize your workforce absence management?
Join 2,000+ HR teams using Absencely to reduce administrative burden, improve compliance, and boost employee satisfaction.