

Most HR departments track absences backward—counting sick days, filing paperwork, updating spreadsheets. Operations scramble every morning when three people call out and nobody saw it coming. The disconnect between HR data collection and actual staffing decisions creates this daily chaos where managers text frantically at 6am trying to find coverage while HR's absence reports sit untouched from last quarter.
The businesses that actually solve this don't just track better—they forecast forward and tie predictions directly to staffing actions. Not through complex statistical models that nobody understands, but through practical absence forecasting models that translate patterns into specific decisions about who to schedule, when to call in backup, and which roles need double coverage. Companies ranging from 15-person medical practices to 500-employee manufacturing facilities show a clear pattern: businesses that connect absence predictions to staffing thresholds reduce their emergency coverage costs by roughly 40% while cutting manager firefighting time in half. The difference isn't the data—everyone has absence data. The difference is turning that data into automatic triggers for staffing decisions before the crisis hits.
Why traditional absence tracking fails at the operational level
HR systems capture absence data religiously. Every sick day logged, every vacation approved, every FMLA case documented. Yet when Tuesday morning arrives and your shipping supervisor plus two warehouse workers are out, that pristine data does nothing to solve the immediate problem of getting orders out the door.
The fundamental break happens because absence data lives in isolation from operational planning. HR tracks historical patterns for compliance and reporting. Operations needs forward-looking predictions tied to specific coverage requirements. These two worlds rarely connect until someone's already scrambling.
Take a 75-person distribution center during their November-December peak season. Historical data shows absence rates jump from 4% to 11% during these months—combination of flu season, holiday conflicts, and burnout from mandatory overtime. HR knows this pattern exists. They have three years of spreadsheets proving it. But that knowledge doesn't automatically trigger the facility manager to schedule two extra floaters for the shipping department starting November 15th. The data exists, the pattern is obvious, but the operational response remains reactive.
This gap widens as businesses grow. A 20-person company can handle absence planning through informal communication—everyone knows when someone's out, coverage happens organically. Cross the 50-employee threshold and informal coordination breaks down. By 100 employees, you're dealing with multiple departments, varying criticality levels, and coverage requirements that change by role and season.
Building forecasting that connects to actual decisions
Effective absence forecasting models don't predict perfect attendance percentages—they identify when specific coverage thresholds will be crossed and trigger predetermined staffing actions. The model becomes useful when it tells you "based on current patterns, you'll likely need extra coverage in receiving next Thursday" rather than "absence rate projected at 8.3%."
Stop managing absences manually.
Absencely simplifies leave requests, approvals, and absence monitoring for your entire workforce.
- Automated leave tracking
- Manager approval workflows
- Compliance & reporting tools
No credit card required
Start with role criticality mapping. Not every absence creates equal disruption. A senior accountant out during month-end close causes different problems than a junior sales rep missing a regular Tuesday. Map each role across two dimensions: operational impact when absent and replaceability on short notice.
A medical practice discovered their real vulnerability wasn't doctor absences—they had coverage protocols for that. Their crisis point was their single medical coder being out, which backed up billing for days and created cash flow problems weeks later. Once identified, they cross-trained an administrative assistant for basic coding tasks and built triggers into their scheduling: when the primary coder has any absence indicators (scheduled or patterns suggesting upcoming absence), the backup automatically gets scheduled for overlap hours.
Next, establish your decision thresholds. These are the specific points where absence predictions trigger staffing actions:
| Threshold | Trigger Point | Action Required | Lead Time Needed |
|---|---|---|---|
| Green | Normal absence patterns | Standard scheduling | None |
| Yellow | 1-2 absences in critical roles predicted | Backup staff alerted | 24-48 hours |
| Orange | 3+ absences or multiple critical roles | Overtime authorized, temps contacted | 48-72 hours |
| Red | Department coverage below 70% | All-hands coverage mode, other departments loan staff | Immediate |
These aren't arbitrary percentages—they're operational reality checkpoints. A restaurant chain found their kitchen could function at 80% staffing on Tuesday lunch but needed 95% coverage for Friday dinner rush. Their thresholds adjusted by day and shift, not just raw numbers.
Set thresholds by shift and daypart so triggers reflect real operational demand rather than a single daily average.
A restaurant chain found their kitchen could function at 80% staffing on Tuesday lunch but needed 95% coverage for Friday dinner rush. Their thresholds adjusted by day and shift, not just raw numbers.
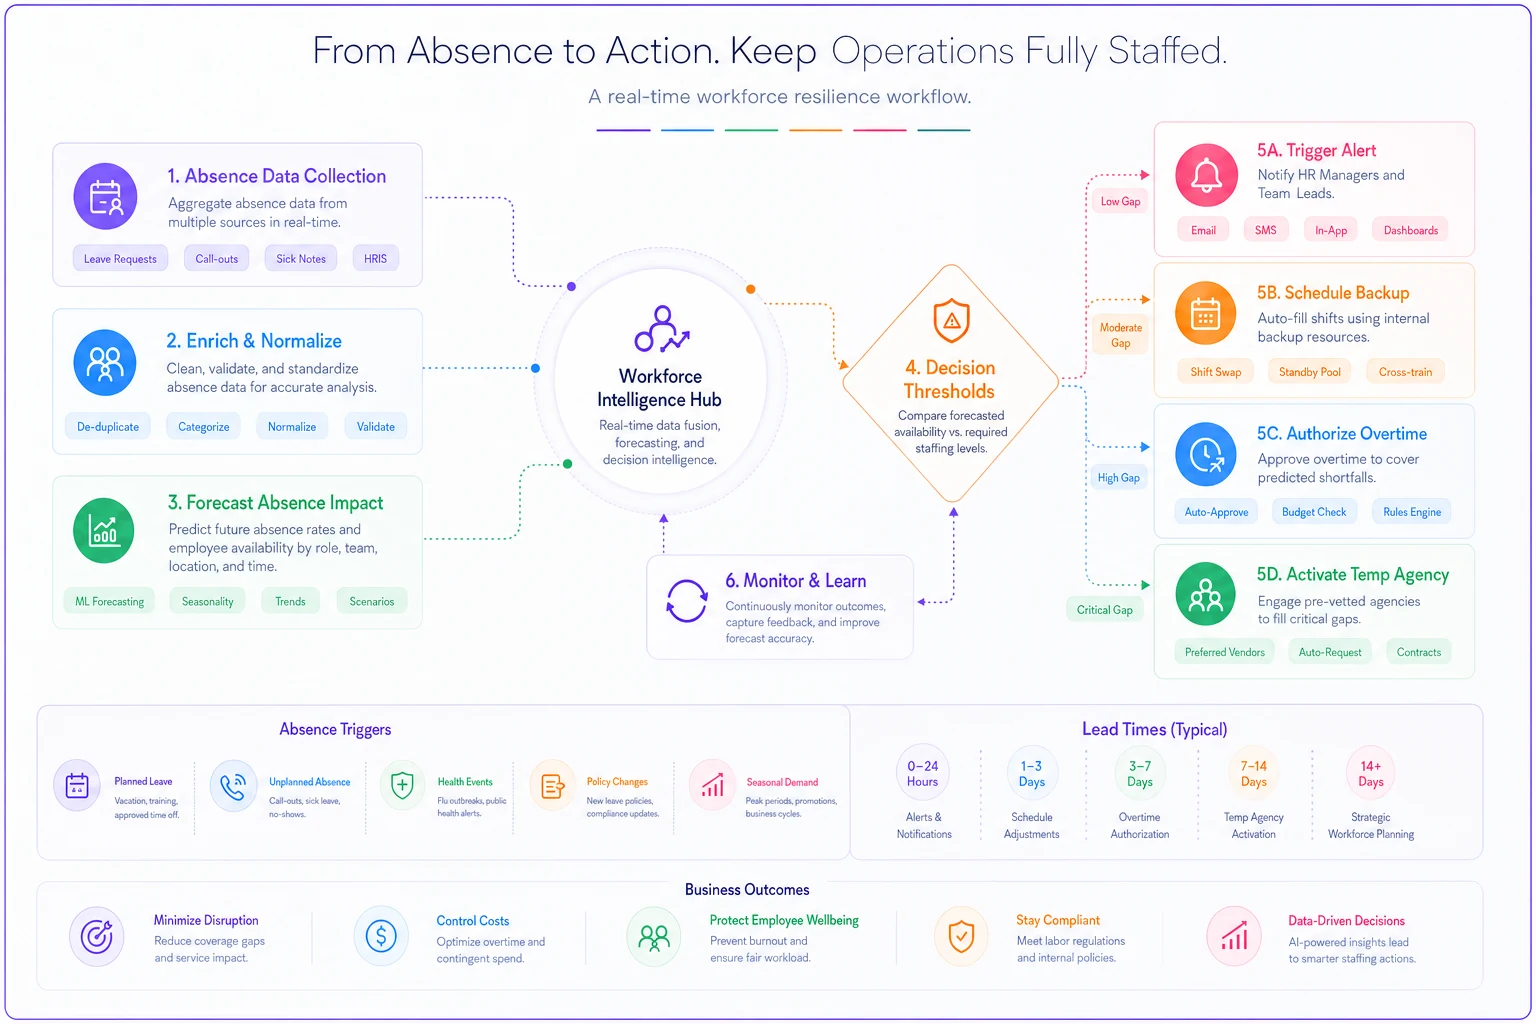
This diagram shows how data flows into thresholds and then into specific staffing actions with lead times.
These aren't arbitrary percentages—they're operational reality checkpoints. A restaurant chain found their kitchen could function at 80% staffing on Tuesday lunch but needed 95% coverage for Friday dinner rush. Their thresholds adjusted by day and shift, not just raw numbers.
Seasonality adjustments that reflect operational reality
Annual absence patterns follow predictable curves, but most businesses either ignore them completely or apply generic "flu season" adjustments that don't match their specific operational rhythm. Real seasonality adjustments need to capture your unique business cycle, not textbook patterns.
Map your absence patterns against your operational calendar. A tax preparation firm sees absence spikes in early January (post-holiday burnout) and late April (end-of-season exhaustion), but their critical coverage need runs February through April 15th. Their absence forecasting models weight these periods differently—a 10% absence rate in January is manageable, but the same rate in March triggers emergency staffing protocols.
Manufacturing operations often show different patterns. One automotive parts supplier tracked three distinct absence seasons: hunting season (rural workforce), school breaks (parents with limited childcare), and extreme weather periods (transportation issues). Their forecasting model adjusts baseline predictions based on which seasonal factors are active, sometimes stacking multiple adjustments when periods overlap.
Build adjustments from your actual data, not industry assumptions. Track absence rates by week for at least one full year, then overlay:
-
Your business cycle (busy seasons, slow periods)
-
Local factors (school calendars, regional events)
-
Weather patterns (especially for outdoor or commute-dependent work)
-
Internal factors (inventory periods, system upgrades, mandatory training)
One distribution center found their highest absence rates occurred the week after mandatory overtime periods ended—employees were burning accumulated time off. Once identified, they built this into their coverage planning, automatically scheduling 15% extra coverage for the "recovery week" after any peak period.
Sample metrics that drive real staffing decisions
The metrics that matter for absence forecasting aren't academic—they're the numbers that tell you whether you'll have enough people to run operations tomorrow. Here's what actually moves the needle:
Rolling absence velocity: Instead of monthly absence rates, track the 7-day rolling average of unexpected absences. When this number accelerates beyond normal variation, you're heading for a coverage crisis. A logistics company found that when their rolling absence velocity exceeded 6% for three consecutive days, they had a 70% chance of hitting critical coverage gaps within the next week.
Role coverage depth: For each critical position, calculate how many people can provide adequate coverage. Not perfect replacement, but adequate to keep operations running. A dental practice tracked this and discovered that while they had multiple people who could cover reception duties, only one person besides the office manager knew how to run insurance verifications—a daily bottleneck that stopped patient flow when uncovered.
Absence clustering coefficient: Absences rarely distribute evenly. They cluster by department, shift, and social groups. Track when multiple absences occur in connected groups. A retail operation noticed that absences in their loading dock team clustered—when one person called out, there was a 40% chance of another dock worker calling out within 48 hours. They started scheduling backup coverage automatically when the first absence occurred.
Time-to-breakdown metrics: For each role and department, establish how long operations can function without coverage before hitting critical failure. Your IT helpdesk might manage six hours without full coverage, but your customer service lines fail after 30 minutes.
Build these metrics into dashboards that connect to scheduling systems. The moment your rolling absence velocity crosses threshold, your scheduling team gets alerted. When coverage depth drops below minimum, backup staff receive availability queries automatically.
Worked example: Applying the full framework
A 120-person food processing facility faced chronic Monday morning coverage crises that demonstrate how this framework works in practice.
Starting situation: Every Monday, especially after holiday weekends, they'd face 10-15% absence rates in production roles. Managers spent the first two hours of each Monday calling in off-shift workers, approving overtime, and reshuffling schedules. Production regularly started late, missing shipping deadlines.
Phase 1: Role criticality mapping They identified five critical bottleneck positions: line leads (needed for safety compliance), quality inspectors (regulatory requirement), forklift operators (material flow), packaging machine operators (technical skill), and sanitation lead (pre-operation requirement). Absence in any of these roles stopped or severely slowed production.
Phase 2: Historical pattern analysis Looking at six months of data, they found:
-
Monday absence rates averaged 12% versus 5% other days
-
Post-holiday Mondays hit 18-22%
-
Packaging department had highest absence clustering
-
Morning shift (5am start) had 3x the absence rate of day shift
Phase 3: Prediction model setup Built simple prediction rules:
-
Base Monday absence
12%
-
Add 8% for post-holiday
-
Add 5% if previous week had mandatory overtime
-
Add 3% during local school breaks
-
Multiply by 1.3 for morning shift
Phase 4: Threshold triggers When predicted absence exceeded 10% for critical roles:
-
Thursday afternoon
Text all backup qualified staff about Monday availability
-
Friday morning
Confirm extra coverage, approve overtime if needed
-
Sunday evening
Final coverage check, activate emergency list if needed
Phase 5: Operational integration The scheduling supervisor received alerts Thursday when Monday's predicted absence crossed thresholds. Pre-approved overtime budgets kicked in automatically for predicted high-absence periods. Backup staff got scheduled proactively, not reactively.
Results after 90 days:
-
Monday production delays dropped from average 90 minutes to 15 minutes
-
Overtime costs actually decreased by $4,000 monthly (planned overtime cheaper than emergency overtime)
-
Manager time spent on coverage issues dropped from 10 hours to 2 hours weekly
-
Employee satisfaction improved—backup staff appreciated advance notice versus 5am panic calls
Results after 90 days:
When forecasting creates more problems than it solves
Not every organization benefits from formal absence forecasting models. Businesses under 30 employees often have better results from cross-training and flexible coverage than from prediction systems. The overhead of tracking, analyzing, and responding to predictions exceeds the benefit when you can see and respond to patterns informally.
Highly variable businesses also struggle with forecasting accuracy. Event companies, seasonal operations, and project-based work have too many moving variables for standard absence patterns to emerge. One event planning company tried implementing forecasting but found that event schedules, client demands, and venue changes created more variability than absences ever did.
Organizations with rigid union rules or staffing regulations might find predictions useless if they can't act on them. A hospital unit had perfect absence predictions but couldn't schedule extra coverage due to strict ratio requirements and budget constraints. Knowing problems are coming without ability to respond just creates stress.
The worst case is when forecasting becomes another reporting burden without operational integration. HR generates weekly absence predictions that go into binders nobody reads while operations continues their morning scramble.
Decision thresholds that trigger automatic responses
The power in absence forecasting comes from removing human decision delays. When predictions cross predetermined thresholds, responses trigger automatically. This isn't about removing human judgment—it's about removing the delay between recognition and action.
A contact center built these automatic triggers:
When absence predictions for tomorrow exceed 8%:
-
System texts all part-time staff about extra hours availability
-
Supervisor reviews and approves overtime for willing staff
-
Quality monitoring reduced to free up senior agents for calls
-
Break schedules adjusted to maintain coverage
When predictions exceed 12%:
-
Remote work staff asked to come on-site for easier coordination
-
Training sessions canceled to return trainers to phones
-
Escalation protocols adjusted to reduce supervisor call time
-
Temp agency automatically notified for following day backup
These aren't suggestions or guidelines—they're automatic operational adjustments. The supervisor doesn't decide whether to text part-time staff when absences hit 8%. It happens automatically. This removes the "maybe we'll be okay" delay that turns manageable situations into crises.
Build these triggers into your operational software. When absence forecasting models predict threshold breaches, scheduling systems adjust, communication platforms alert staff, and backup protocols activate.
Scale considerations: From manual tracking to automated response
Small operations start with spreadsheet tracking and group text coordination. This works until around 40 employees, when the complexity overwhelms manual systems. The transition to automated absence forecasting typically happens in stages, each solving specific scale problems.
Stage 1 (Under 50 employees): Basic pattern recognition Track absences in a central system, identify weekly patterns, adjust schedules manually based on observed trends. A plumbing company with 30 technicians started by noticing Monday/Friday patterns and scheduling extra on-call coverage those days.
Stage 2 (50-150 employees): Department-level forecasting Different departments show different patterns. Build separate predictions for each area. Connect predictions to department managers who handle their own coverage. A small manufacturer ran predictions for production, warehouse, and office separately, with each manager receiving their department's forecast.
Stage 3 (150-500 employees): Integrated prediction and response Centralized forecasting feeds multiple systems. Predictions trigger scheduling changes, overtime approvals, and temp agency requests automatically. The human role shifts from making coverage decisions to managing exceptions.
Stage 4 (500+ employees): AI-enhanced optimization Machine learning models identify complex patterns humans miss. Predictions account for dozens of variables, optimizing coverage across multiple constraints. The system suggests not just who needs coverage, but who should provide it based on skills, costs, and availability.
The key at each stage is maintaining the connection between prediction and action. A sophisticated AI model that doesn't trigger operational responses is worth less than a simple spreadsheet that drives real scheduling decisions.
Beyond basic coverage: Optimizing for productivity and cost
Advanced absence forecasting models go beyond just ensuring minimum coverage—they optimize for maintaining productivity and controlling costs during absence periods. This means understanding not just who's out, but how their absence impacts overall operations.
A fulfillment center tracked productivity impacts by role and found surprising patterns. Senior warehouse workers' absences caused 20% productivity drops in their zones, but junior workers' absences barely registered—until three or more were out simultaneously, when productivity crashed 35%. Their forecasting model now weights absences differently: one senior absence triggers backup coverage, but junior absences only trigger response when clustered.
Cost optimization comes from understanding the true expense of different coverage options. Emergency overtime costs more than planned overtime. Temp agency workers on short notice cost 3x more than those scheduled in advance. Cross-trained employees covering unfamiliar roles work at 60% efficiency. Build these cost factors into your response thresholds.
A medical practice calculated that paying a part-time nurse to be on-call cost $200 weekly but saved an average of $1,400 in emergency staffing and cancelled appointments. Their absence forecasting triggers now automatically activate on-call schedules when predictions suggest 20% chance of nurse absence.
The most sophisticated operations also factor in cascade effects. When a team lead covers for an absent worker, their leadership tasks go undone. When experienced workers train temps, their own productivity drops. Accurate forecasting accounts for these secondary impacts, sometimes choosing to operate short-staffed rather than triggering costly cascade coverage.
The compound effect of proactive absence management
The real value of connecting absence forecasting models to operational decisions compounds over time. Each crisis avoided saves more than just that day's disruption—it preserves manager energy, maintains employee morale, and builds operational resilience that pays dividends during real emergencies.
When managers stop spending mornings scrambling for coverage, they arrive focused on improvement projects, not firefighting. They have energy for coaching and development, not just crisis management. A regional retail chain found that stores with proactive absence management showed 15% better sales performance—not because absences decreased, but because managers could focus on customer service and sales training instead of coverage puzzles.
Employee morale improves when coverage feels planned, not panicked. Staff appreciate advance notice for extra shifts. They respect organizations that handle absences professionally, not through guilt and emergency pleading. Backup workers who get reliable advance scheduling become more willing to help, creating a deeper coverage bench over time.
The operational benefits multiply during actual crises. When COVID hit, businesses with established absence forecasting and response systems adapted faster. They already had triggers for high-absence scenarios, backup coverage protocols, and automation for scheduling adjustments. While others built emergency response from scratch, they simply adjusted their existing thresholds and triggers.
This systematic approach to absence management also surfaces other operational improvements. Patterns in the data reveal training gaps, burnout risks, and workflow bottlenecks that absence merely exposed. Fix these underlying issues and absence rates often improve as a bonus, though that was never the primary goal.
The businesses thriving despite labor shortages and increased absence rates aren't the ones with perfect attendance—they're the ones that turned absence from a daily surprise into a managed operational variable. Their forecasting models don't eliminate absences, but they eliminate the chaos absences create. That's the difference between reactive scrambling and proactive operations: not perfect prediction, but systematic response that keeps the business running regardless of who shows up tomorrow.
Ready to optimize your workforce absence management?
Join 2,000+ HR teams using Absencely to reduce administrative burden, improve compliance, and boost employee satisfaction.