


Most HR teams can tell you how many absence days happened last quarter. Very few can tell finance which cost center those days hit, why, and what the business should do about it. That gap is where absence cost allocation lives — and where it quietly falls apart in almost every mid-sized company.
You already have the raw data. The problem is that raw absence data and a finance-ready cost model are two completely different things. One is a log of events. The other is a normalized, disputable, month-repeatable ledger that a controller will actually sign off on. Getting from the first to the second is less about spreadsheets and more about agreeing on rules before anyone runs a number.
This is a systems article, not a tips list. The point isn't "here are five ways to track absence costs." It's how the whole allocation pipeline connects — normalization, showback, dispute handling, and the decisions that come out the other end — and where it breaks as the company grows.
Why absence cost allocation breaks before it starts
The failure almost never happens at the calculation step. It happens earlier, when nobody agreed on definitions.
-
Direct wage cost — the paid absence itself
-
Replacement cost — overtime, temp labor, agency premiums to cover the gap
-
Productivity drag — the work that didn't happen, or happened slower
-
Administrative load — the hours managers, HR, and payroll spend processing the absence
If HR counts only direct wages and finance counts wages plus temp cover, you're not disagreeing about absence. You're disagreeing about what the word "cost" means. That has to be settled first, in writing, or every downstream number gets contested.
TACR and CPAD-style models (total absence cost rate / cost-per-absence-day frameworks) are useful precisely because they force this. They make you declare which layers count and how each one converts into dollars. The trap is treating them as academic. A model that lives in a consultant's slide deck helps nobody. The version that survives is the one translated into repeatable monthly practice.
Normalization rules: the boring part that decides everything
Before you allocate a single dollar, you need normalization rules — the conversions that turn messy real-world absence into comparable units. This is the least glamorous and most important part of the entire framework.
Stop managing absences manually.
Absencely simplifies leave requests, approvals, and absence monitoring for your entire workforce.
- Automated leave tracking
- Manager approval workflows
- Compliance & reporting tools
No credit card required
A few normalization decisions that reliably cause fights if left implicit:
Loaded vs. unloaded labor rate. Are you costing absence at base wage or fully-loaded (benefits, taxes, employer contributions)? Finance almost always wants loaded. HR often defaults to base. Pick loaded, apply a consistent multiplier — typically somewhere in the 1.25–1.4 range depending on your benefits load — and document it.
Partial days and intermittent leave. A four-hour absence isn't half a day if the shift is ten hours. Normalize to hours, then roll up. Rounding to full days feels simpler but silently inflates or deflates costs depending on shift length.
Replacement-cost attribution. If a temp covers three absent people across two departments, whose cost center eats it? You need a rule — usually proportional to hours covered — before it happens, not after.
Salaried absence. This is where models get sloppy. A salaried person's paid sick day has no incremental wage cost (you paid them anyway), but it has real productivity and coverage cost. Decide whether you're allocating cash cost or economic cost. Both are valid. Mixing them mid-model is not.
One thing most teams miss: normalization rules must be versioned. When you change the loaded-rate multiplier in March, every historical comparison shifts. If you don't stamp each month's numbers with the ruleset version that produced them, your year-over-year trends become fiction. Treat the rules like code with a changelog.
Version your normalization rules like code with a changelog so historical comparisons stay truthful.
When you change rules, stamp the month's numbers with the ruleset version that produced them; otherwise trend analysis breaks.
Showback before chargeback (almost always)
There's a real distinction here that gets blurred:
| Aspect | Showback | Chargeback |
|---|---|---|
| What it does | Reports allocated absence cost to each cost center | Actually moves the cost onto their budget |
| Political friction | Low | High |
| Data quality required | Good | Near-perfect |
| Behavior change | Awareness | Direct accountability |
| Best for | First 6–12 months | After the model is trusted |
Jumping straight to chargeback is one of the most common ways this initiative dies. The moment a department's budget gets debited, every disagreement about your inputs becomes a formal dispute — and if your normalization rules aren't rock-solid yet, you'll spend all your credibility defending methodology instead of driving decisions.
Run showback first. Let managers see their allocated numbers monthly for a couple of quarters with no budget impact. They'll poke holes, you'll fix rules, and by the time you flip to chargeback the model is battle-tested and most of the arguing is done. Companies that skip this phase almost always end up rebuilding the model after the first ugly budget cycle anyway.
A monthly showback template that survives contact with reality
The template itself should be dead simple to read and boring to produce. If generating it is a heroic monthly effort, it won't survive past month three.
A workable monthly showback layout, per cost center:
-
Absence days (normalized to hours) — split by type
sick, FMLA/protected, PTO overage, unplanned no-show
-
Direct wage cost — loaded rate × hours
-
Replacement cost — temp/overtime attributed to this center
-
Estimated productivity impact — using your declared method
-
Admin cost — standard per-event processing estimate × event count
-
Total allocated cost
-
Cost per FTE — the number that actually enables cross-department comparison
-
Variance vs. trailing 3-month average
-
Top 2 drivers this month — one line of plain-language context
That last line matters more than people expect. A number with no driver attached generates questions; a number with "driven by two long-term STD cases in the warehouse team" generates decisions. Finance doesn't want a spreadsheet, they want the why pre-attached.
Cost-per-FTE is the quiet hero of the whole template. Raw totals make big departments always look bad. Cost per FTE normalizes for headcount and actually surfaces the department running hot. That's the comparison that changes behavior.
If you haven't already built the underlying unit economics, the numbers in this template come straight out of a proper cost-per-absence engine — we walked through the assumptions and sensitivity testing for that in the cost-per-absence model and ROI workbook, and the showback template is essentially that model rendered monthly per cost center.
Dispute governance and RACI (or the whole thing collapses)
The single most predictable failure point: someone disputes a number, there's no defined process, and the argument escalates to whoever's loudest. Do that twice and department heads stop trusting the report entirely.
You need a lightweight dispute process defined before the first dispute arrives.
The dispute workflow, end to end:
-
Manager receives monthly showback and flags a specific line within a fixed window (say, 10 business days)
-
Dispute goes to a single owner — usually an HR analyst — not into a group email
-
Owner classifies it
data error, attribution disagreement, or methodology objection
-
Data errors get corrected and re-issued, logged with a reason code
-
Attribution disagreements get resolved against the written normalization rules
-
Methodology objections get parked — they don't change the current month, they go to a quarterly review of the ruleset
-
Anything unresolved after the window escalates to a named finance + HR pair, not a committee
Step six saves the entire framework. Most "disputes" are actually people wanting to relitigate the rules mid-cycle. If you allow that, your numbers never stabilize. Separate "this month's number is wrong" from "I don't like how we do this" and route them to completely different tracks.
| Activity | HR Analyst | HR Lead | Cost Center Manager | Finance |
|---|---|---|---|---|
| Produce monthly showback | R | A | I | C |
| Approve normalization rules | C | R | C | A |
| Raise disputes | I | I | R | I |
| Resolve data errors | R | A | C | I |
| Quarterly methodology review | C | A | C | R |
| Approve move to chargeback | C | C | I | A/R |
The mistake to avoid: making everyone "consulted" on everything. That's how you get a model nobody owns and a monthly cycle that stalls waiting on sign-offs.
Here's a visual of the dispute workflow to share in the first manager training session.
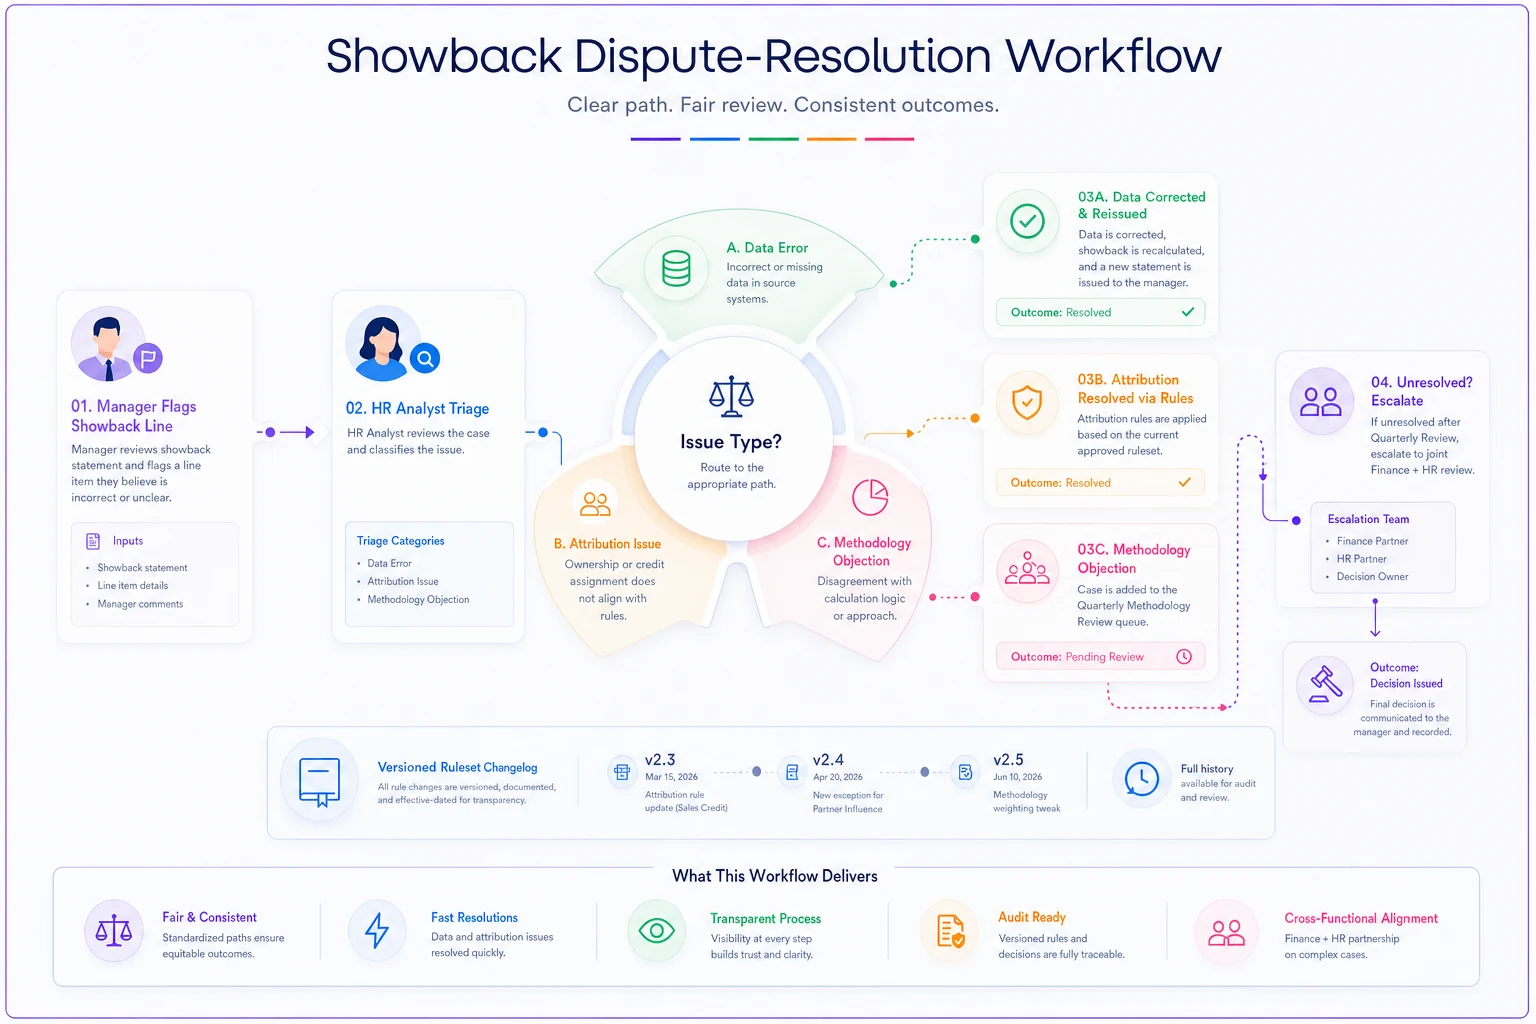
Keep this diagram simple and put it in the showback cover email so managers know the steps before they open a dispute.
Worked example: tying an absence driver to a real P&L decision
Numbers make this concrete. Take a distribution center, roughly 85 FTE on the warehouse floor.
In a given month the showback shows the warehouse cost center at about $41k in total allocated absence cost, versus a trailing average near $28k. Cost per FTE jumped from roughly $330 to just under $485. The driver line reads: "two concurrent long-term STD cases plus elevated unplanned no-shows on the night shift."
-
The two STD cases are protected and mostly outside management's control — call it around $16k of the total. That's a known, accept-and-plan cost.
-
The night-shift no-shows account for the rest of the spike, roughly $9k above trend, driven by heavy overtime and one weekend of agency temps at premium rates.
Now it's a decision, not a data point. The STD cost is noise you plan around. The night-shift no-show cost is actionable — it's a coverage-model failure, and $9k/month annualizes toward six figures if it holds. That justifies a specific intervention: adjusting night-shift staffing buffer, or piloting a shift-swap incentive, with a clear budget to beat.
Without allocation, this shows up as "absence was expensive last month" and nothing happens. With allocation, finance and ops are looking at one number, split into controllable and uncontrollable, arguing about the fix instead of the inputs. That's the whole point of the exercise.
Connecting these drivers to actual staffing moves is its own discipline — the decision-threshold logic for that lives in the absence-data-to-staffing-outcomes forecasting playbook, which pairs naturally with a cost model like this one.
The sample workbook structure
You don't need enterprise software to start. A well-built workbook does the job for a long time. Structure it in clearly separated tabs so the rules never get tangled with the outputs:
-
Tab 1 — Assumptions loaded-rate multipliers, admin cost per event, productivity method, ruleset version + date
-
Tab 2 — Raw absence feed one row per absence event, hours-based
-
Tab 3 — Normalization engine applies the rules from Tab 1 to Tab 2, nothing hard-coded
-
Tab 4 — Cost-center rollup the actual monthly showback per department
-
Tab 5 — Dispute log date, line item, classification, reason code, resolution
-
Tab 6 — Trend cost per FTE by center over trailing 12 months
The non-negotiable design rule: no manual number ever lives in the rollup tab. Every figure traces back through the normalization engine to a raw event and an assumption. The first time someone types a "corrected" number directly into the output, the model loses its audit trail and, with it, finance's trust.
Where this breaks at scale
The workbook approach works well up to a point. Then it doesn't.
The breaking points are predictable. Once you're past a few hundred employees or operating across several jurisdictions, the raw feed stops fitting cleanly in a spreadsheet, normalization rules multiply (different loaded rates by region, different absence categories by legal regime), and the monthly production cycle becomes a two-person job everyone dreads. The dispute log grows faster than anyone maintains it.
That's usually when teams move the normalization engine and the monthly rollup into their absence or workforce platform, so raw events flow in automatically and the allocation runs on a schedule instead of by hand. The value isn't magic — it's that the ruleset, the versioning, and the dispute log stop depending on one analyst remembering to run everything. Automating the repetitive normalization and rollup work is what keeps the model repeatable once volume kills the manual version. The framework doesn't change; only who does the grinding does.
When this framework makes sense — and when it doesn't
It makes sense when: you have multiple cost centers, department heads who control staffing decisions, and a finance team that budgets absence at all. The whole value is enabling accountable decisions across units.
It's premature when: you're under roughly 50 people with one manager. There's nothing to allocate between — you already know where the cost is, and building a formal model is overhead with no payoff.
Skip chargeback specifically if: your data quality isn't solid yet, or your org is politically fragile. Moving money before the model is trusted turns a helpful report into a monthly war. Stay on showback longer than feels necessary.
The teams that get real mileage out of absence cost allocation aren't the ones with the fanciest model. They're the ones who agreed on normalization rules early, ran showback patiently, and built a dispute process before the first dispute arrived. The math is easy. The governance is what makes it stick.
The teams that get real mileage out of absence cost allocation aren't the ones with the fanciest model. They're the ones who agreed on normalization rules early, ran showback patiently, and built a dispute process before the first dispute arrived. The math is easy. The governance is what makes it stick.
Ready to optimize your workforce absence management?
Join 2,000+ HR teams using Absencely to reduce administrative burden, improve compliance, and boost employee satisfaction.