

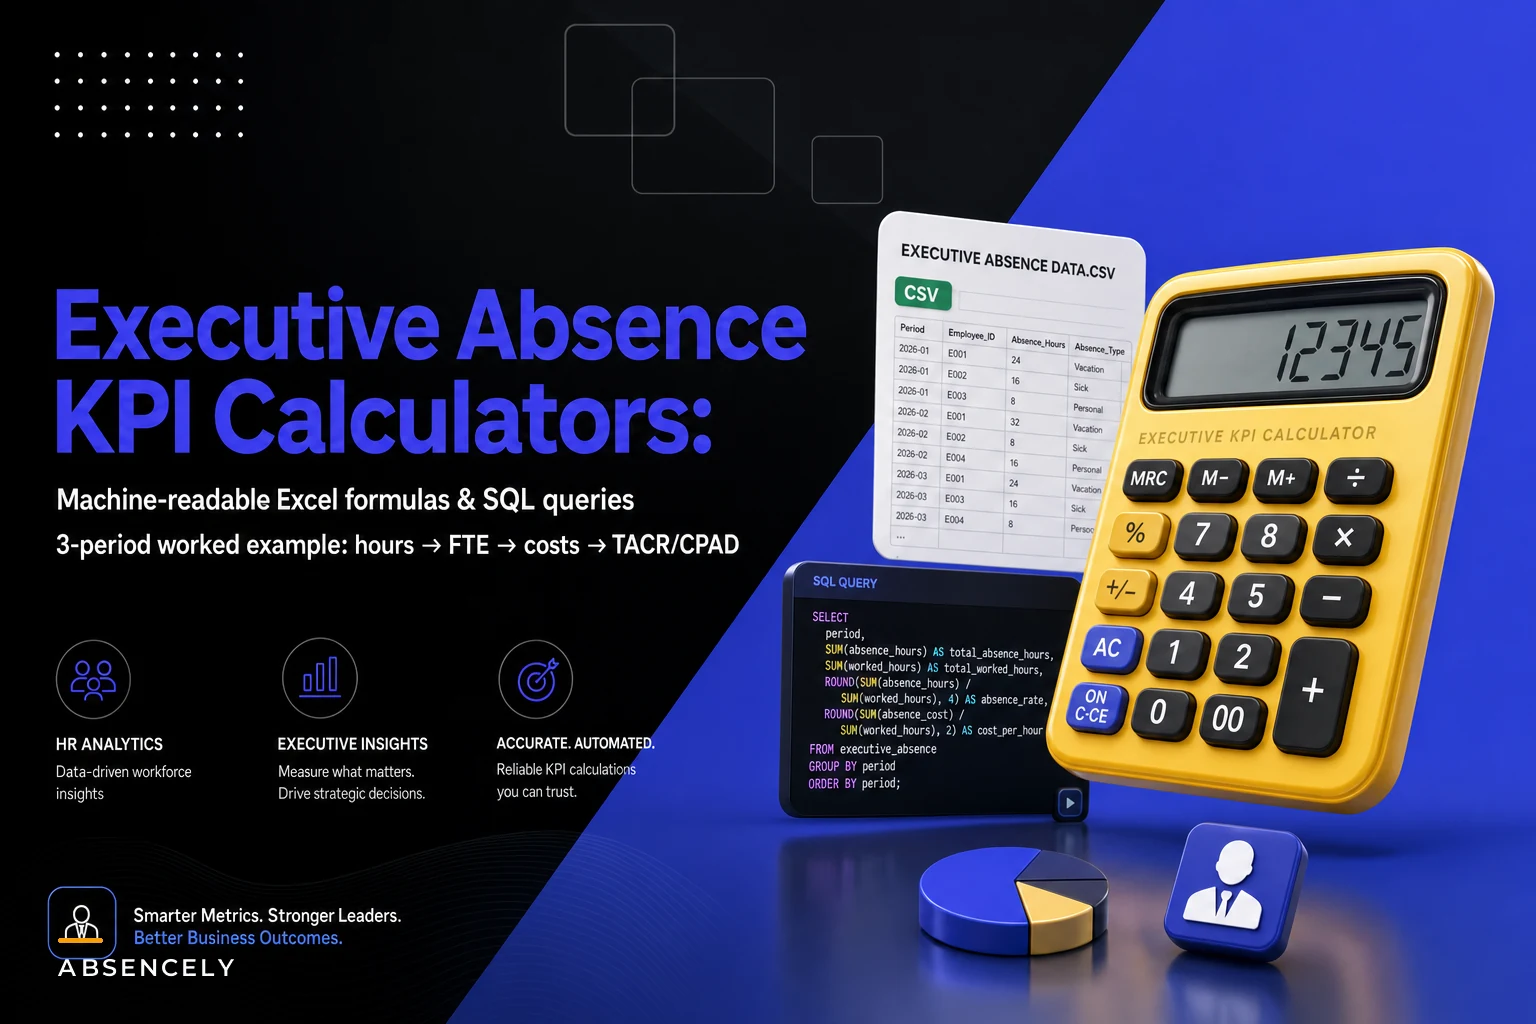

Most teams can define their absence KPIs on a slide. Far fewer can reproduce them in a spreadsheet and get the same number twice. The gap almost always shows up when someone in finance recalculates your reported figure and lands 11% off, and nobody in the room can explain why.
This post is the hands-on companion for that exact moment. You get the actual absence KPI formulas in both Excel and SQL form, a sample dataset you can model from, worked arithmetic for a three-period scenario, and the data-field and data-quality rules that keep your numbers from drifting. It assumes you already know what TACR and CPAD are and why your executive team cares. If you need the strategic framing — which KPIs to prioritize and how to set targets — the executive absence scorecard post covers that side. This one is about getting the math right and keeping it right.
The core problem: your formula lives in three places and none of them agree
The pattern comes up constantly. The KPI definition lives in a governance doc. The actual calculation lives in someone's spreadsheet with hardcoded assumptions. And the "official" number on the dashboard comes from a BI query written by someone who left eight months ago.
When those three sources disagree, the argument is never about strategy. It's about whether a partial-day absence counts as 0.5 days or as actual logged hours, or whether the FTE denominator uses scheduled hours or a flat 2,080. Tiny decisions, but across a 400-person org they move your Total Absence Cost Ratio by real money.
-
Time unit of record
hours (not days). Convert to FTE-days only at the reporting layer.
-
FTE-day basis
what counts as one full FTE-day of scheduled time (e.g., 8.0 hours, or role-specific).
-
Cost scope
which cost drivers are in TACR (direct wages paid, overtime premium, agency markup — and whether you include recruiting/backfill).
-
Partial-day handling
always logged as actual hours, never rounded to half-days.
Get those agreed, and the formulas below become deterministic.
Data fields you actually need (and the ones people forget)
You can compute every KPI here from a surprisingly small table. The field everyone forgets is scheduled_hours — people store absence hours but not what the person was supposed to work, which makes FTE conversion guesswork.
Stop managing absences manually.
Absencely simplifies leave requests, approvals, and absence monitoring for your entire workforce.
- Automated leave tracking
- Manager approval workflows
- Compliance & reporting tools
No credit card required
Make
scheduled_hoursa required field in ingestion to prevent FTE-day inflation.
| Field | Type | Notes |
|---|---|---|
employee_id | string | Stable ID, not name |
event_date | date | One row per day for multi-day events (don't store ranges) |
absence_hours | decimal | Actual hours lost that day |
scheduled_hours | decimal | What they were scheduled to work |
absence_type | string | sick / FMLA / PTO / unplanned, etc. |
basehourlyrate | decimal | For wage cost |
department | string | For grouping / waterfall |
cover_method | string | none / overtime / agency |
cover_hours | decimal | Hours of coverage actually used |
cover_cost | decimal | Loaded cost of that coverage |
One row per employee per day. Range storage ("Mar 3–Mar 10") is where multi-period calculations quietly break — you end up re-expanding ranges with inconsistent logic every single time.
Simple data-quality rules to run before you calculate anything
-
absencehoursmust be> 0and<= scheduledhourson that day (unless you explicitly allow over-schedule, which usually means a data error). -
No duplicate
(employeeid, eventdate, absence_type)combinations. -
coverhours > 0requirescovercost > 0and acover_methodother than "none." -
scheduled_hoursis non-null for every row — null here is the single most common cause of FTE-day inflation. -
basehourlyrateis within a sane band (flag anything outside, say, $8–$150; catches decimal-shift errors).
Rule two matters more than it looks. A typical example: an absence gets logged by the manager, then re-logged by the HR system sync, and suddenly one sick day counts twice. On a single person it's noise. Across a quarter it's a visible bump in your reported hours lost that finance will absolutely notice.
The formulas (Excel + SQL)
1. Hours lost → FTE days
FTE-days is total absence hours divided by your agreed FTE-day basis.
Excel (assuming absence hours in B2:B1000, FTE basis of 8.0):
=SUM(B2:B1000)/8
If you use role-specific scheduled hours as the basis instead of a flat 8, convert per-row then sum:
=SUMPRODUCT(B2:B1000 / C2:C1000)
where C is each row's standard full-day hours.
SQL:
SELECT SUM(absencehours) / 8.0 AS ftedaysflat, SUM(absencehours / NULLIF(standarddayhours, 0)) AS ftedaysrolebased FROM absenceevents WHERE eventdate BETWEEN :periodstart AND :periodend;
The NULLIF guard is deliberate — it turns a bad zero into a null instead of a divide-by-zero crash, which makes the row visible instead of killing the whole query.
2. TACR — Total Absence Cost Ratio
TACR expresses total absence-related cost as a share of total labor cost. The definition we recommend:
TACR = (lostproductivewagecost + coveragecost) / totallaborcost
-
lostproductivewagecost= absencehours × basehourlyrate (the wage you paid for time not worked, where applicable) -
coverage_cost= sum of overtime premium + agency markup used to backfill -
totallaborcost= total payroll + total coverage spend for the period
SQL:
WITH cost AS ( SELECT SUM(absencehours * basehourlyrate) AS lostwage, SUM(covercost) AS coveragecost FROM absenceevents WHERE eventdate BETWEEN :periodstart AND :periodend ), labor AS ( SELECT SUM(periodpayroll) AS totalpayroll FROM payrollsummary WHERE period = :periodid ) SELECT (cost.lostwage + cost.coveragecost) / NULLIF(labor.totalpayroll + cost.coveragecost, 0) AS tacr FROM cost CROSS JOIN labor;
One thing that trips people up: decide once whether totallaborcost in the denominator includes coverage cost. If coverage is in the numerator but excluded from the denominator, TACR drifts upward as you use more agency labor — which can make a staffing fix look like it made absence cost worse. Keep both sides consistent.
3. CPAD — Cost Per Absence Day
CPAD = (lostproductivewagecost + coveragecost) / totalftedays_lost
Excel (total cost in F2, FTE days in F3):
=F2/F3
CPAD is the number executives grasp fastest, but it's also the most misleading if your FTE-day denominator uses half-day rounding. Round partial days up to 0.5 and your CPAD drops artificially because the denominator inflates. This is exactly why the hours-based convention isn't pedantic.
Worked three-period scenario
A concrete example so you can validate your own implementation against it. A mid-sized operations team, roughly 180 employees, 8.0-hour FTE-day basis. Three consecutive months.
Raw inputs:
| Period | Absence hours | Avg base rate | Coverage method | Coverage cost |
|---|---|---|---|---|
| P1 | 1,240 | $31 | OT + some agency | $9,800 |
| P2 | 1,610 | $31 | heavier agency | $15,400 |
| P3 | 1,090 | $32 | mostly OT | $7,200 |
Total period payroll ran about $980k, $995k, and $1.01M respectively.
Step 1 — FTE days lost:
-
P1
1,240 / 8 = 155 FTE-days
-
P2
1,610 / 8 = 201.25 FTE-days
-
P3
1,090 / 8 = 136.25 FTE-days
Step 2 — Lost wage cost:
-
P1
1,240 × $31 = $38,440
-
P2
1,610 × $31 = $49,910
-
P3
1,090 × $32 = $34,880
Step 3 — Total absence cost (wage + coverage):
-
P1
38,440 + 9,800 = $48,240
-
P2
49,910 + 15,400 = $65,310
-
P3
34,880 + 7,200 = $42,080
Step 4 — CPAD:
-
P1
48,240 / 155 ≈ $311 per FTE-day
-
P2
65,310 / 201.25 ≈ $325 per FTE-day
-
P3
42,080 / 136.25 ≈ $309 per FTE-day
Step 5 — TACR (denominator = payroll + coverage):
-
P1
48,240 / (980,000 + 9,800) ≈ 4.87%
-
P2
65,310 / (995,000 + 15,400) ≈ 6.46%
-
P3
42,080 / (1,010,000 + 7,200) ≈ 4.14%
TACR delta, P1 → P2: +1.59 points. P2 → P3: −2.32 points.
What's interesting here — and what a raw dashboard won't show — is that P2's CPAD only rose about $14 over P1. But TACR jumped 1.59 points. That means the spike wasn't mainly about absences getting more expensive per day. It was about volume (201 FTE-days vs 155) plus a shift toward pricier agency coverage. Same symptom, very different root cause. That distinction changes whether you go after attendance or your coverage mix.
The cost-driver waterfall: explaining the delta
The waterfall turns "TACR went up 1.59 points" into something an executive can actually act on. You decompose the period-over-period change into additive drivers.
Decompose the P1 → P2 cost change ($48,240 → $65,310, a $17,070 increase) into three drivers:
-
Volume effect — more FTE-days lost at P1's cost structure. (201.25 − 155) × P1 CPAD of $311 ≈ +$14,384
-
Rate/wage effect — change in base wage cost per day. Rate held at $31, so ≈ $0 here.
-
Coverage-mix effect — the residual, driven by heavier agency use. 17,070 − 14,384 − 0 ≈ +$2,686
So of the $17,070 increase, roughly $14.4k is pure volume and about $2.7k is the more expensive coverage mix. If someone proposed "cut agency spend" as the fix for P2, the waterfall says that only addresses about 16% of the problem. The absences themselves are the story.
Target delta
-
P2 actual cost
$65,310
-
Target cost at 4.5% of (995,000 + 15,400)
≈ $45,468
-
Target delta
about $19,800
to close
Now you can allocate that $19,800 against the waterfall drivers and know which lever actually moves the needle.
Spreadsheet and SQL templates to reproduce this
To rebuild the above in a spreadsheet, structure three tabs:
-
events— raw per-day rows matching the schema above. -
period_rollup— SUMIFS by period for absence hours, lost wage, coverage cost; calculated FTE-days, CPAD, TACR columns. -
waterfall— volume/rate/mix decomposition with the prior period's CPAD referenced explicitly so the math is auditable.
A reusable SUMIFS pattern for the rollup tab:
Absence hours: =SUMIFS(events!$D:$D, events!$B:$B, A2) Lost wage: =SUMIFS(events!$I:$I, events!$B:$B, A2) FTE days: =[absence hours cell]/8
Where column I is a helper column = absencehours * basehourly_rate computed per row. Keep the per-row helper visible — don't bury the multiplication inside the SUMIFS — because when finance audits you, they'll want to click into a single row and see the arithmetic.
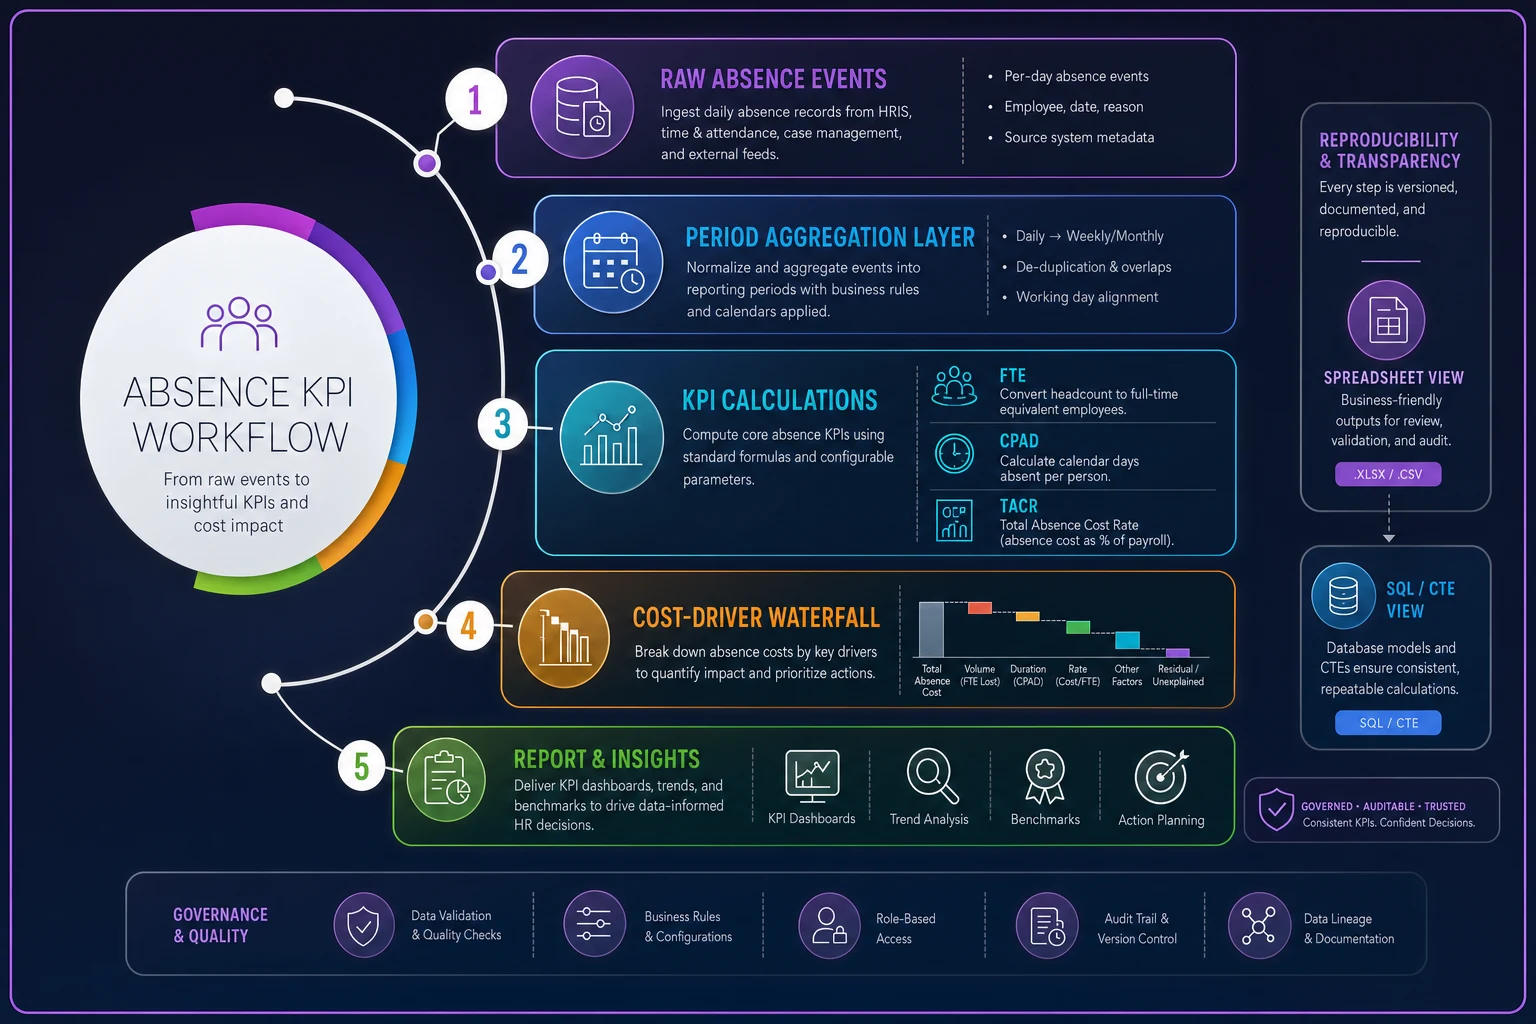
The cleanest reproducible SQL pattern is a single CTE chain: raw events → period aggregates → KPI layer → waterfall. Materialize the period aggregate as a view so dashboard and audit queries read the same source.
Where teams get this wrong
A few failure patterns worth naming — the ones that survive code review and still produce wrong numbers:
-
Mixing day-based and hour-based logic across periods. Someone computes P1 in days and P3 in hours, and the trend line is meaningless.
-
Letting null
scheduled_hourssilently default to 8. Part-time staff then get counted as full FTE-days lost, inflating everything. -
Putting coverage cost in the TACR numerator but not the denominator, so staffing decisions distort the ratio.
-
Re-expanding stored date ranges differently each run, which is why one-row-per-day storage isn't optional.
-
Rounding partial days to 0.5. It quietly deflates CPAD and makes your cost-per-day look better than it is.
These patterns often look subtle in a code review but produce audit-time disagreements that stop budgets and decisions.
When this level of rigor is worth it — and when it isn't
If you're reporting absence KPIs to a board, allocating cost back to departments, or setting targets that trigger hiring or budget decisions, the hour-based, waterfall-decomposed approach is the only version that survives scrutiny. The deterministic formulas matter because the numbers get argued over.
If you're a small team tracking directional trends for your own planning, this is overkill. A simple days-lost count and a rough coverage cost will tell you whether things are getting better or worse. You don't need a waterfall for that.
The honest middle case: most teams need the rigor on TACR and the cost waterfall because those drive money decisions, and can stay loose on softer operational metrics. Pick your precision level based on what the number actually decides.
A short real scenario
A regional distribution operation, around 210 staff, kept reporting absence cost that finance refused to sign off on — the HR dashboard and the finance recalculation landed roughly 9–12% apart every month. The disagreement stalled their annual absence budget for most of a quarter.
The root cause was two of the patterns above hitting at once: part-time warehouse staff had null scheduled hours defaulting to 8, and multi-day FMLA events were stored as ranges and re-expanded with slightly different weekend logic in the two systems. Once they moved to one-row-per-day storage, enforced non-null scheduled hours, and standardized the FTE-day basis, the two numbers converged to within about 1%. Nothing about their actual absences changed — only the arithmetic became reproducible. The budget got signed off the following month.
That's the whole point of this work. Reproducible absence KPI formulas don't reduce absence. They make the number trustworthy enough that people stop arguing about the math and start acting on it.
Wrapping up
Lock your four conventions, store one row per employee per day, run the data-quality pre-flight before you calculate, and keep the dashboard and the audit query reading from the same aggregated source. Do that, and TACR, CPAD, and the cost-driver waterfall become deterministic — same inputs, same outputs, every time.
The worked three-period example above is there to copy and validate against. If your own implementation lands on roughly $311 CPAD for P1 and a +1.59 TACR delta into P2 from the same inputs, your math is sound. If it doesn't, there's a convention mismatch somewhere — and now you know exactly which five rules to check first.
Lock your four conventions, store one row per employee per day, run the data-quality pre-flight before you calculate, and keep the dashboard and the audit query reading from the same aggregated source. Do that, and TACR, CPAD, and the cost-driver waterfall become deterministic — same inputs, same outputs, every time.
The worked three-period example above is there to copy and validate against. If your own implementation lands on roughly $311 CPAD for P1 and a +1.59 TACR delta into P2 from the same inputs, your math is sound. If it doesn't, there's a convention mismatch somewhere — and now you know exactly which five rules to check first.
Ready to optimize your workforce absence management?
Join 2,000+ HR teams using Absencely to reduce administrative burden, improve compliance, and boost employee satisfaction.