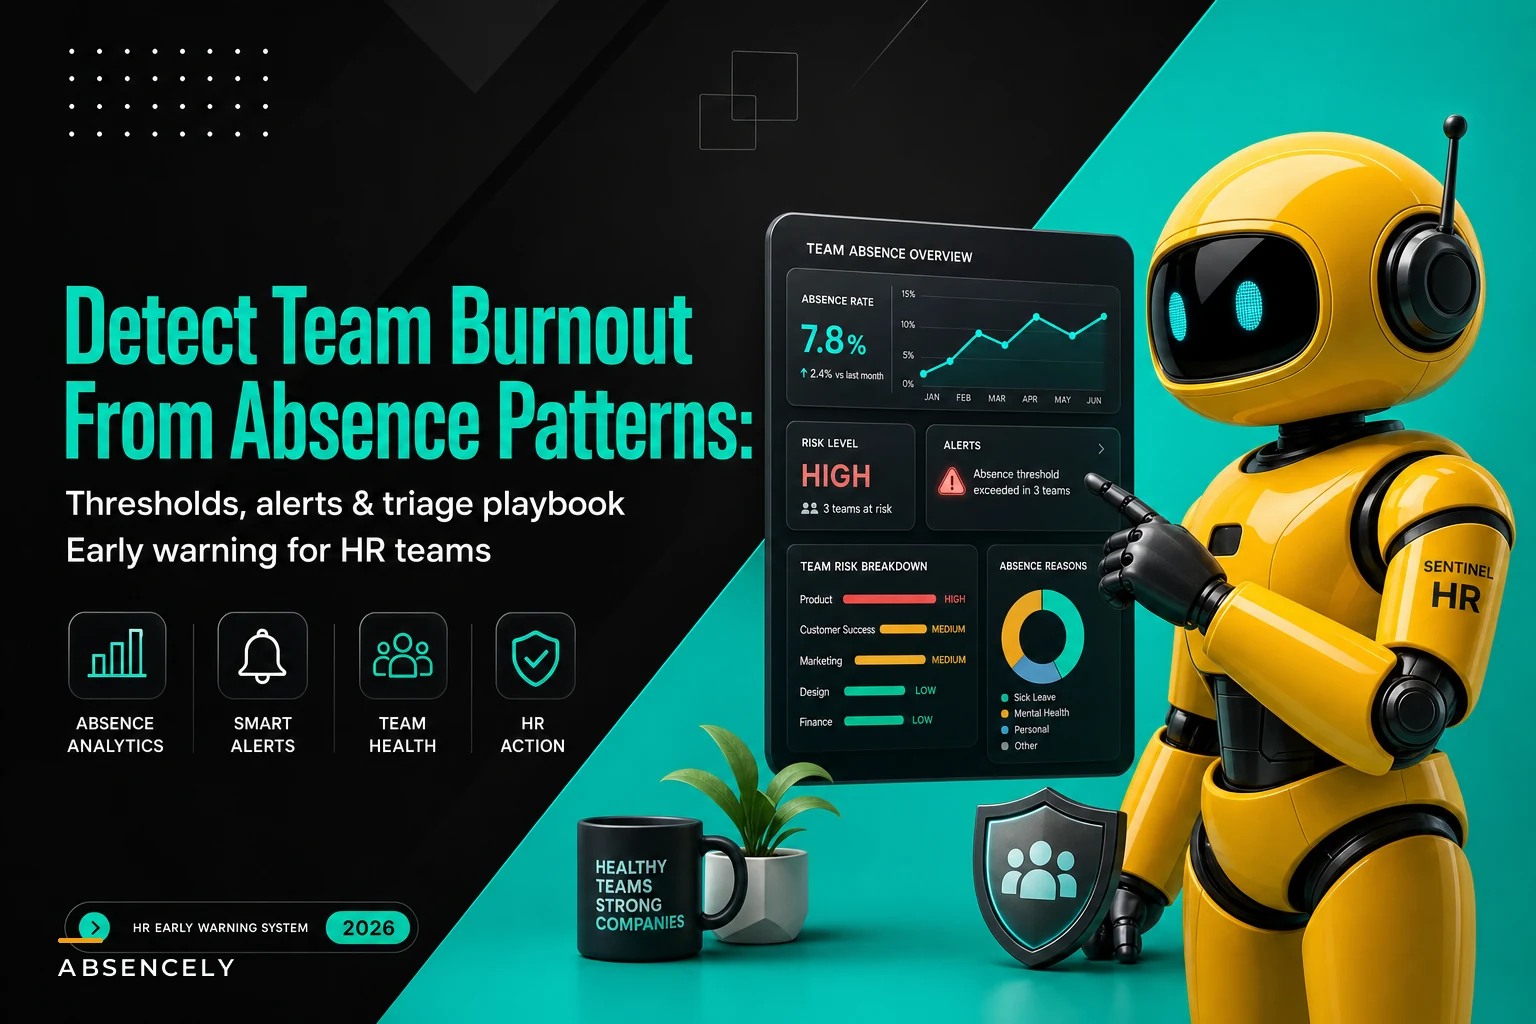

Three weeks ago, a marketing agency discovered their creative team was hemorrhaging talent. Not because people were quitting—that came later. The warning signs were buried in their absence tracking spreadsheet: sporadic Monday call-outs, extended lunch breaks logged as "appointments," and sudden upticks in single-day sick leaves clustered around project deadlines. By the time leadership noticed the pattern, two senior designers had already mentally checked out, and the entire Q4 campaign schedule was at risk. Every signal was there in their absence data six weeks earlier. They just didn't know what patterns to look for.
Why Traditional Absence Tracking Misses Burnout Signals
Most businesses track absences for compliance and payroll. You log sick days, approve vacation requests, maybe run a monthly report showing total days off by department. That's basic hygiene, not operational intelligence.
Standard absence tracking treats all absences equally. A planned two-week vacation looks the same as ten scattered sick days in your monthly report. But operationally? These tell completely different stories about team health.
Real burnout detection requires watching for micro-patterns—the subtle shifts in how people take time off that signal deeper problems. A developer who starts taking Friday afternoons off every other week. A customer service rep who suddenly needs multiple "family emergencies" right after difficult client calls. These patterns hide in plain sight when you're just counting total days. Burnout manifests differently across roles too. Sales teams might show increasing "client meeting" blocks that are actually mental health breaks. Technical teams often display what I call "the Thursday syndrome"—taking Thursdays off to create long weekends without triggering vacation policies. Support teams tend toward reactive absences—calling out the morning after particularly brutal shifts.
Building Your Detection Framework: The Micro-Patterns That Matter
After analyzing absence data across hundreds of small businesses, certain patterns consistently predict burnout risk. Not every pattern means burnout—sometimes people just have legitimate health issues or family situations. But when multiple patterns emerge simultaneously, you're looking at systemic team health problems.
Stop managing absences manually.
Absencely simplifies leave requests, approvals, and absence monitoring for your entire workforce.
- Automated leave tracking
- Manager approval workflows
- Compliance & reporting tools
No credit card required
The Bridge Day Pattern Strategic single-day absences that create extended weekends. Watch for Mondays and Fridays, especially around minor holidays. When someone takes off the Friday before Memorial Day, that's normal planning. When they take off random Fridays in February, March, and April, you're seeing early burnout behavior.
The Recovery Absence These cluster after high-stress periods—product launches, quarter ends, major client deliveries. A single recovery day is normal. When you see rolling recovery absences (one team member out Monday, another Tuesday, another Wednesday), your team is operating beyond sustainable capacity.
The Creeping Duration Starts with half-day absences that gradually extend. Someone takes Friday afternoon off for an "appointment." Next month it's a full Friday. Month after that, it's Thursday afternoon plus Friday. They're unconsciously creating distance from work stress.
The Substitution Pattern People who stop taking real vacations and instead use sick days sporadically. They'll have 15 days of PTO banked but take 12 sick days throughout the year. This signals someone who can't mentally afford to fully disconnect—they're managing stress through small escapes.
Setting Alert Thresholds That Actually Work
Raw thresholds don't work because team contexts vary wildly. A 15% absence rate might be normal for a call center but catastrophic for an accounting firm during tax season. Build relative thresholds based on baseline patterns instead.
Start by establishing team baselines over a 90-day period when operations are stable. Track average weekly absence hours per person, distribution patterns (clustered vs. scattered), day-of-week preferences, and notice periods for planned absences.
Your alert thresholds then trigger on deviations from baseline, not absolute numbers.
Yellow Alert (Monitor)
-
30% increase in unplanned absences over rolling 30 days
-
Pattern shifts (someone who always gave a week's notice now calling out same-day)
-
New clustering behaviors (multiple team members absent on same days)
Orange Alert (Investigate)
-
50% increase in bridge day patterns
-
Three or more team members showing similar absence patterns
-
Sudden shift from vacation days to sick days
-
Recovery absences becoming predictable
Red Alert (Intervene)
-
Team absence rate doubles from baseline
-
Key performers showing erratic patterns
-
Absence patterns correlating with specific projects or managers
-
Multiple orange indicators present simultaneously
One operations manager at a logistics company built what she called a "pattern score." Each micro-pattern got weighted points: bridge days = 2 points, recovery absences = 3 points, duration creep = 4 points. When someone hit 10 points in a month, it triggered a casual check-in. At 15 points, it escalated to a workload review.
Your Triage Protocol: From Detection to Action
Detection without action is just sophisticated worrying. You need a clear triage protocol that turns pattern recognition into operational intervention.
Level 1 Triage: The Temperature Check When yellow alerts trigger, resist the urge to formally intervene. Create natural touchpoints instead. Have the direct manager schedule a regular one-on-one focused on current projects, not absence patterns. Listen for phrases like "it's been crazy lately" or "just trying to keep up."
When yellow alerts trigger, schedule informal one-on-ones focused on current work rather than formal absence reviews.
Document observations without making them feel like surveillance. Note energy levels during meetings, response times to routine requests, quality changes in regular work, and interaction patterns with teammates.
Level 2 Triage: The Workload Audit Orange alerts require examining structural issues. Pull the person's actual workload data—not just assigned tasks, but the hidden work. How many "quick questions" do they field daily? How often are they pulled into emergency fixes? What's their actual versus planned capacity?
A design agency found their lead designer was spending 15 hours weekly on "consultations"—informal reviews that weren't tracked anywhere. No wonder she was burning out. The absence pattern revealed an operational problem hiding in plain sight.
Level 3 Triage: The Reset Intervention Red alerts demand immediate structural changes. This isn't about offering yoga classes or mental health apps. It's about fundamentally restructuring how work flows through your team.
Options that actually work include mandatory project rotation to break repetitive stress patterns, temporary workload caps (maximum tickets, calls, or projects), buddy systems where burned-out employees partner with others, and protected focus blocks where they're truly unavailable.
Preventive Interventions Mapped to Risk Levels
Prevention beats detection every time, but most preventive measures are too generic to matter. "Encourage work-life balance" doesn't prevent burnout any more than "eat healthy" prevents diabetes. You need specific interventions based on risk indicators.
For Early-Stage Patterns (1-2 micro-patterns present): Institute "pressure release valves"—scheduled opportunities for micro-recovery that prevent absence accumulation. Every third Friday afternoon becomes optional "professional development time." People can work on learning, organize their workspace, or honestly, just leave early. This controlled release prevents uncontrolled absences.
One consulting firm implemented "maintenance Mondays"—the first Monday each month had no client meetings scheduled. Teams used this for planning, training, or catching up. Their unplanned absence rate dropped about 40% over six months.
For Mid-Stage Patterns (3-4 micro-patterns or orange alerts): Deploy "circuit breakers"—automatic workload limits that kick in when patterns emerge. If someone hits three bridge days in six weeks, their new project assignments automatically pause for review. Not punishment—protection.
This requires operational discipline. A software company built rules into their project management system: when someone's absence pattern score exceeded threshold, they couldn't be assigned to new sprints without director approval. It forced conversations about capacity before crisis hit.
For Late-Stage Patterns (red alerts or multiple orange alerts): Activate "recovery protocols"—structured step-backs that prevent full burnout. Temporary role rotation to less stressful functions, sabbatical options (even unpaid) before they quit entirely, and project handoff procedures that don't punish the person for needing help.
The Workflow Integration That Makes This Sustainable
Most burnout detection programs fail because they require HR to manually track patterns, calculate thresholds, and remember to check alerts. That's not sustainable when you're already juggling compliance, recruitment, and daily fires.
The solution is embedding detection into existing workflows. Your absence management system should automatically flag pattern changes, not just count days. When someone requests time off, the system should show their recent pattern score alongside the approval button. When patterns hit thresholds, alerts should flow directly to managers, not sit in HR reports.
A retail chain with 200 employees built pattern detection into their scheduling software. Managers saw risk indicators right on the schedule view—yellow dots for emerging patterns, orange for concerns, red for intervention needed. They caught burnout patterns 3-4 weeks earlier than their previous manual reviews.
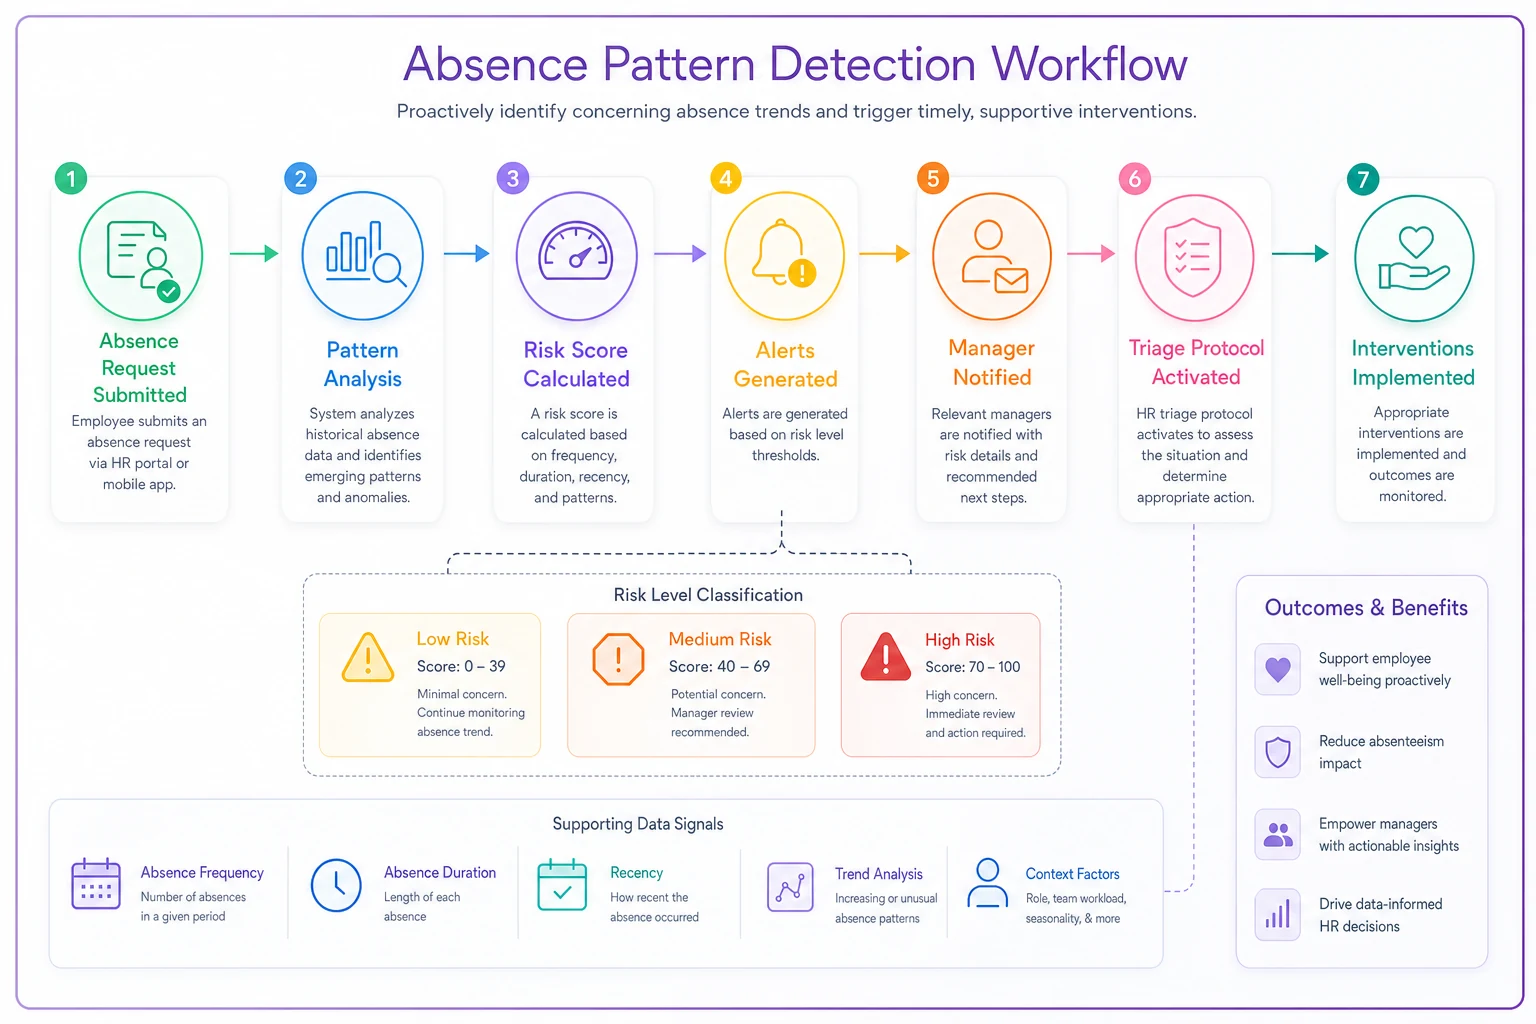
Workflow: Absence Pattern Detection Process
-
Employee submits absence request
-
System analyzes historical patterns automatically
-
Risk score calculated based on recent behaviors
-
Alert generated if threshold exceeded
-
Manager receives notification with context
-
Triage protocol activates
-
Intervention or monitoring action implemented
This workflow runs continuously in the background. AI-powered operational software handles pattern matching across multiple signals—time-off requests, actual absences, schedule changes, even email response times if integrated. It builds pattern profiles for each employee without feeling like surveillance because it's analyzing operational data you're already collecting.
Visualizing this workflow clarifies responsibilities at each step.
The automation learns team-specific baselines, adjusts for seasonal variations, and surfaces only the alerts that matter. No more HR manually scanning spreadsheets for patterns that humans typically miss anyway.
Making the Business Case: Why This Matters Beyond HR
Burnout detection through absence patterns isn't just an HR initiative—it's operational risk management. When senior employees burn out, you lose institutional knowledge that takes months to rebuild. When entire teams burn out simultaneously, projects fail and clients leave.
| Cost Category | Per Burned-Out Employee | Example Impact |
|---|---|---|
| Replacement Cost | 50-200% of annual salary | $50K-$120K for $60K role |
| Coverage Overtime | 15-25% additional labor cost | $9K-$15K for team coverage |
| Knowledge Loss | 3-6 months reduced productivity | Project delays, quality issues |
| Team Morale | Ripple effect on 3-5 colleagues | Additional turnover risk |
One accounting firm tracked the real impact: every burned-out senior accountant cost them about $45,000 in recruitment and training, plus another $30,000 in overtime for coverage, plus immeasurable client relationship damage. They implemented pattern detection and interventions, cutting burnout-related turnover by roughly half. The system paid for itself in three months.
The math is straightforward when you factor in hidden costs. Training replacement employees takes time away from productive team members. Quality drops during transition periods. Client relationships suffer when experienced people leave.
Most businesses only calculate direct replacement costs—job postings, interview time, maybe onboarding expenses. They miss the operational disruption that ripples through teams for months.
The Patterns You'll Start Seeing
Once you implement systematic pattern detection, certain realities become impossible to ignore. Burnout rarely happens randomly—it follows predictable operational triggers.
Maybe it's your monthly reporting cycle that consistently drives absences. Maybe it's certain client accounts that correlate with team exhaustion. Maybe it's the way projects get assigned that creates unsustainable peaks.
The absence patterns become a diagnostic tool for operational problems. When multiple people show burnout patterns after working with the same manager, you have a leadership issue. When patterns cluster around specific project types, you have a resource planning problem. When patterns emerge seasonally, you need capacity planning adjustment.
This isn't about becoming Big Brother. It's about recognizing that absence patterns are operational signals, like equipment maintenance logs or quality control metrics. They tell you when your human systems are under stress before they break.
The playbook works when you treat it as operations intelligence, not employee surveillance. Focus on patterns, not people. Address systems, not symptoms. Prevent problems, not just detect them. Your team's absence patterns are telling you a story about operational health—the question is whether you're equipped to read it.
Ready to optimize your workforce absence management?
Join 2,000+ HR teams using Absencely to reduce administrative burden, improve compliance, and boost employee satisfaction.